

 In most regions of the sun, radiation is the dominant form of heat transfer.
Photons in the sun are scattered by heated charged particles that are absorbed
and reemitted many times before reaching the surface, generally in the form
of visible light rays.
However, in a region covering an approximate 200,000km
radius of the outer layers of the sun, fluctuations in density, temperature and pressure
cause massive amounts of energy to be transported by circulating fluid motion, or convection.
Volumes of moving hot gas transfer energy to the top of the convection zone
where it is released in the form of radiation. The gas then becomes denser, and sinks
under gravitational force to a point where more energy is absorbed, completing
a convection cycle.
Convection is responsible for most of the phenomena occurring on the otherwise
bland surface of the sun. Granules, which are the visible peaks of the convection currents, can
be observed from earth. These are intricate cell patterns alternating between light and dark that
represent rising and descending fluid flow. Granules
in the photosphere and supergranules
in the chromosphere, as well as sunspots, prominences, and solar flares
can be attributed to a pairing of convective motions with the strong solar
magnetic fields.
In certain parts of the convection zone, lines of magnetic field become compressed due to pressure resulting from fluid motions. This creates a strong Lorentz force around these areas, inhibiting fluid currents from flowing through the dense magnetic fields. These regions, containing cooler fluid than other areas of the sun, release less radiation into space and appear darker relative to the rest of the sun. They are called sunspots, and on average, are around 10,000km in diameter. In its lifetime, an average sunspot can block 20,000 times more light than the earth receives within an equal amount of time. There are many different balances of forces and energies operating within the convection zone, such as this combination of fluid flow and magnetic pressure exerted within sunspots, that influence the behavior of the sun's outer layers. Scientists have had much difficulty explaining the motion of fluid flow in the convection zone since observation cannot delve much deeper than the outer chromosphere. Turbulence and non-linear effects, inherent to fluid flow in general, add to the complexity of the convection zone. Only recently have scientists been able to develop computer simulations such as SUMO2 to probe into the physics beyond the reach of observation.
SUMO2 is a simulation code developed by Dr. Steven R. Lantz, which combines the equations of fluid flow and heat transfer. The code can produce (for example) thermal Rossby waves, which are rolling convection currents, in a region representing a 2-dimensional cross-section of an idealized convection zone. This code was modified, as part of this project, to include magnetic field and Lorentz force terms as a part of the simulation. These additions provided us with an interesting look into the magnetic phenomena that ultimately lead to effects such as sunspots.
Given initial conditions, SUMO2 will generate values for the vorticity, temperature, and magnetic flux fields for a specified number of timesteps. These values and their time-evolution are examined using visualization programs designed in PV Wave Advantage (IDL) and Data Explorer that contour the values of these fields. This way, general trends can easily be observed.
 Diagram of the Sun, Courtesy (NASA/ESA)
Equations
The equations used to produce the observed effects of magnetohydrodynamic (or MHD) motions are presented below. These equations are implemented in the code of SUMO2 and define the values and evolution of the vorticity, temperature, and magnetic field at every given point and time within simulation specifications.
The Navier-Stokes Equation

The Navier-Stokes Equation is the fundamental equation of fluid dynamics. It describes the motion of fluid at a point, based upon a sum of forces which are labelled above. For this project, the Navier-Stokes equation has been altered to include the Lorentz force, which resists the motion of charged particles across a magnetic field.
The Heat Equation

This equation describes how the temperature changes at a point under the influence of the fluid flow and diffusion. Diffusion, in this case, represents the effects of turbulence at scales below the scales we are modelling.
The Boussinesq Approximation

The Boussinesq Approximation states, in a way, that the density of a fluid is nearly constant. Variations in density enter the equation of motion only through a buoyancy force term.
The Equation of State

This describes a relationship between the density and the temperature of a fluid. The form above is an approximation of the Ideal Gas Law. It connects the Heat Equation to the gravity term of the Navier-Stokes Equation.
The Magnetic Induction Equation

This equation, defined more thoroughly later on, governs the evolution of the magnetic flux function. This equation can be used when the magnetic field has been restricted to lie in a plane.
Approximations
In this simulation, the convection zone of the sun is modeled using only the most relevant and important physical factors. This allows us to highlight the more significant influences on the fluid motion as well as quicken calculations and conserve computing resources. The selected approximations are illustrated in this diagram.
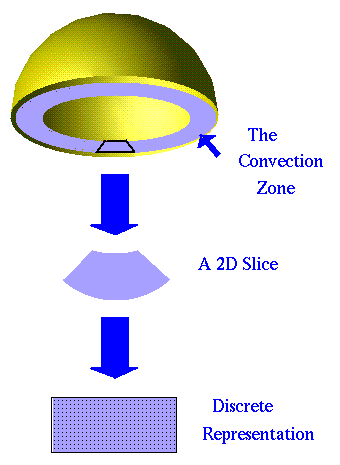
| The first approximation made is in accordance with the Taylor-Proudman theorem, which states that the degree of fluid flow taking place along the direction of the rotation axis of a strong flow is relatively small. This allows us to limit the simulation of the convection zone to a 2 dimensional continuum. |
| From there, the continuum is represented as a discrete spatial grid where the magnetic, temperature, and vorticity fields are defined only at regular intervals along the cross-sectional surface. This allows us to use the finite difference method to take derivatives. With this method, values taken from neighboring points are used to compute the fields at the next timestep on the grid. |
In order to incorporate magnetic fields into the simulation, the Magnetic Induction Equation and the Lorentz force had to be included within the code. Here is a description of each of these physical laws.
The Magnetic Induction Equation
The starting point to describe the Magnetic Induction Equation is one of Maxwell's Laws. It states that the divergence of the magnetic field (B) equals zero, that is, there exists no such thing as a magnetic monopole or an open magnetic field line.


Since psi has a relation to the Magnetic field, it inherently has a relation to the Electric field as well.

Psi advances in time according to Ohm's Law and Ampere's Law in a low-frequency limit. (That is, the displacement current, which is the change in electric field with time, is assumed to be negligible.)
Ohm's Law

Ohm's Law explains that the current, j, is proportional to the electric field, with constant of proportionality sigma.
Ampere's Law

Ampere's Law states that the current is proportional to the curl of the magnetic field.
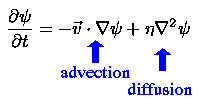
Using vector identities, these equations can be combined to yield the Magnetic Induction Equation, given here. The first term, which represents advection, is non-linear since the velocity depends upon psi as well as other fields that change with time. The second term represents diffusion, and is a linear term in which eta is inversely proportional to the conductivity.
The Magnetic Induction Equation
The Lorentz Force
Most of the fluid in the sun consists of charged particles which are influenced by forces from the strong solar magnetic fields. The force associated with motion across a magnetic field is called the Lorentz force, and appears in an adaptation of the Navier-Stokes equation for our purposes, given earlier. The form of the Navier-Stokes equation we want to use involves a quantity called vorticity, which is the degree to which a fluid is spinning at a point. Omega (which represents vorticity) is defined as the curl of the velocity, so the rate of change of the vorticity is obtained by taking the curl of the Navier-Stokes Equation.
Using vector identities, the curl of the Lorentz force term can be simplified as shown.

When SUMO2 updates the vorticity field, it uses the values of the B field and the second derivative of psi at neighboring points on the grid to determine values of the vorticity for the next timestep. The effect of the Lorentz force is opposite to the direction of fluid motion, resisting forces that cause fluid to cross lines of magnetic force.
The Finite Difference Method
The finite difference method presents a way to take the derivative of a function at a point using only the values of that function at neighboring points. Here is the definition of a derivative from calculus.

Since we are using discrete spacing (the values of the variable are only defined on the points of the grid), a derivative can be approximated this way, assuming the smallest change in x to be the value between adjacent grid points. For example, say we wanted to compute the derivative of psi in the x direction at point (i,j) at a given time. (This also happens to be the value of B in the z direction at that time, necessary for the computation of the Lorentz force term.) We would first take the values of psi on either side of (i,j) in the x-direction and subtract them. This number would be divided by the difference between the subtracted points, that is, twice the value of the unit grid spacing in the x-direction.

Schematically:

To take second derivatives, we just take the derivatives of first derivatives. We can find the first derivative at a place in between any two grid points because we already know the values of the function on the entire grid. The values are subtracted and divided by the difference in spacing, and the second derivative is obtained.


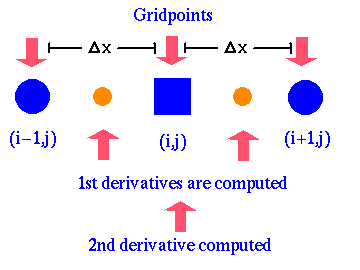
Now, we have a method to determine the first and second derivatives of any defined function at every grid point.
The Runge-Kutta Algorithm
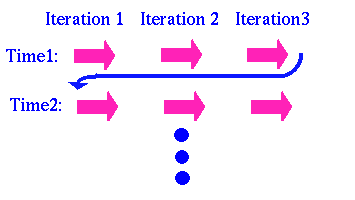
In order for SUMO2 to be able to advance the fields to the next timestep, a 3rd order Runge-Kutta Algorithm is implemented to integrate the time derivative. This is similar, in essence, to a third-order Taylor approximation, in which values of the function and its first and second time derivatives are used to determine future field values. In SUMO2, a technique is used where, through iteration, derivatives are calculated based upon the derivatives of previous iterations. To do this, SUMO2 cycles through its time derivative calculations three times in order to update the fields for the next timestep.
For further explanation, see previous SPUR papers.
The efficiency of the simulation is partially aided by parallelization, where multiple processors are used to compute field values. Different sections of the grid are assigned to different processors (domain decomposition). This allows computations to be done simultaneously, taking less time than a single processor. The gain in speed is partly offest by the need to communicate between processors.
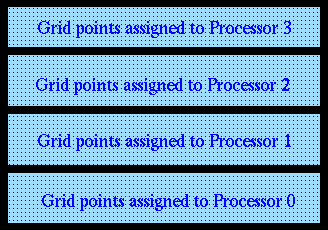
Communication between processors must occur pending two circumstances:
For further reference, see Dr. Lantz's Explanation.
Using the data files the SUMO2 generates, some visualizations were created to give us a grasp on the general trends and overall results of the simulation. But first, the data had to undergo some modifications.
(Note: Unfortunately, the following results were later invalidated by the discovery of a bug in the simulation code. This by no means detracts from Cynthia's excellent work on the visualizations.)
Here are three movies, taken at stages with a varied diffusion parameter. The first movie
has much more diffusion built into it than the last.
The physics that explain these waves is quite complicated, and Dr. Lantz has offered a few suggestions
pending further studies into the physical explanations for our results.
The sequence of movies were produced by varying the magnetic diffusion parameter. Drastic changes,
i.e. a bifurcation,
can be observed between movies as to the tendencies of the magnetic and vorticity
fields just by reducing this parameter from 0.25 to 0.10.
A chart of parameters is available.
Traveling Waves:
 MPEG of a
Modulated Traveling Wave(1MB)
 Graph of Maximum Vorticity vs.
Time for the Modulated Traveling Wave
Without magnetic influence at all, earlier studies done by Dr. Lantz suggest that purely traveling waves are produced with this sort of environment. The influence of the added diffuse magnetic field, shown here, produces the small vertical asymmetry that differentiates this wave from one that is purely traveling. However, the distribution of magnetic fields is still somewhat even, which implies little local build up of either magnetic, kinetic, or thermal energy. A glance at the graph of Maximum Vorticity vs. Time for this state shows a slight bouncing motion. This means that the magnetic field is not entirely constant, i.e. that the traveling wave is not completely steady.
Longer MPEG of a Modulated Traveling Wave(3.0MB)
Intermediate stage
 MPEG of an Intermediate Stage(1.6MB)
 Graph of Maximum Vorticity vs.
Time for the Intermediate Stage
At a point where the diffusion parameter is set exactly in the middle of the other two states, the beginnings of magnetized motion is just visible. This wave exhibits features of the traveling wave, in that the phase velocity is not drastically decreased compared to the earlier movie, and accordingly, the magnetic fields are only slightly built up in localized pockets. However, more magnetic activity is visible, and a higher amplitude of magnetic oscillation is visible in both the graph, and in the movie. Magnetic field lines are stretched by fluid motion, but do not break. Instead, they snap back into place when a more stable state is reached in the cycle.
Longer MPEG of an Intermediate Stage(3.4MB)
Magnetized wave
 MPEG of a Magnetized Nonlinear Oscillation
(1.9MB)
 MPEG of
Magnetized Nonlinear Oscillation (color = Temperature)(1.9MB)
 Graph of Maximum Vorticity vs. Time for the Magnetized Wave
 Graph of Average Vorticity vs. Time for the Magnetized Wave
The diffusion parameter here is set very low, allowing the magnetic field little room to adjust to the flow in any direction. This allows pockets of condensed magnetic fields to form, visible mainly at the top and bottom of the simulation. In these areas, there is a build-up of magnetic energy, that is, a strong Lorentz force, which resists all fluid motion and slows down circulation. The motion of the convection currents then evolves more slowly, and the phase velocity of the traveling is significantly decreased. (Look at the overall speed of the wave as compared to that of the earlier movies). Because the magnetic energy is stored in localized pockets, more energy is available in other forms where magnetic fields aren't condensed, that is, where the lines of magnetic field are spread farther apart. This energy is may be manifested in vertical fluid motion, where magnetic field lines are dragged from the bottom and top of the simulation and stretched to their fullest extent. The lines resist stretching, and sometimes, break and recombine in the center of the field. When this happens, all types of energy (magnetic, vorticity and thermal) appear to decrease, which shows that energy flow is time varying. Pulses of energy move through the simulation, not necessarily transferring from one form to another. The graph of Maximum Vorticity vs. Time indicates large oscillations, as the magnetic field changes, almost violently, throughout the movie. The plot of Average Vorticity vs. Time proves that asymmetry plays a role in the dynamics for the given parameters.
Longer MPEG of a Magnetized Nonlinear Oscillation(4.8MB)
Longer MPEG of a Magnetized Nonlinear Oscillation (color = Temperature) (4.7MB)
In this study, magnetohydrodynamics in the convection zone have been simulated and examined through the use of supercomputers and visualization packages. Magnetic fields have been incorporated into the current simulation, and are shown to have a significant impact on the examined fluid motion. Additions made to SUMO2, a simulation of the convection zone designed by Dr. Steven R. Lantz, include the evolution of the magnetic flux function and the effects of the Lorentz force on the streamfunction. The basis for this added physics has been explained, along with a description of SUMO2 and its purpose. Visualizations have been included that show the effects of the added magnetic field. Hopefully, this project will lead to future studies involving further explanation of the magnetohydrodynamic phenomena occurring within the convection zone.
Thank you for reading this paper. I hope you enjoyed it. :)
My dear parents! Thank you beyond reality! Your support is beyond words!
Aaron, walt and arca will miss us! Yes, you are the bestest computer neighbor ever.
Thanks SPUR, it's been truly superbulous. Be sure to thank IBM for the tender chicken...and Wegmans for the
fine computer. You do try hard to please...and you certainly do.
And, a million trillion billion thanks to my marvelous advisor for indulging my mind for the summer! Thank you for introducing me to your supernifty simulation and allowing me to admire all the work that you do, exploring the universe from sundog and that fascinating mind of yours. I'm infinitely glad I got to meet real science this summer, and find out about its sunny side first. :)
This work was conducted using resources of the Cornell Theory Center (CTC). CTC receives major funding from the National Science Foundation and New York State, with additional funding from the National Center for Research Resources at NIH, the Advanced Research Projects Agency, IBM, and other members of CTC's Corporate Research Institute.
Tritton,D.J. Physical Fluid Dynamics,Van Nostrand Reinhold Company Ltd. New York, N.Y. 1977
Seab, C. Gregory. Astronomy, Springhouse Corporation. Springhouse, P.A. 1995
Giovanelli, Ronald. Secrets of the Sun, Cambridge University Press, Cambridge, G.B. 1984
Lantz, Steven R. "Magnetoconvection Dynamics in a Stratified Layer. I.
Two-Dimensional Simulations and Visualization"The Astrophysical Journal, March 10 1995
Lantz, Steven R. "Magnetoconvection Dynamics in a Stratified Layer. II.
A Low-Order Model of The Tilting Instability,"The Astrophysical Journal, March 10 1995
http://hao.ucar.edu/public/research/mlso/mlso_homepage.html
http://umbra.nascom.nasa.gov/images/latest.html
http://orpheus.nascom.nasa.gov/synoptic/
http://pore1.space.lockheed.com/SXT/homepage.html
http://www.acim.usl.edu/SOLAR/sun/sun_views.html
http://bang.lanl.gov/solarsys/sun.htm
 Back
to Cover Page
